GSoC '23: Implementing Modular Average
Hey everyone, I'm Aritra, a senior pursuing my B.E. degree in
Electrical Engineering at Jadavpur University. This summer, I am
working on adding more summarization functions to the Mathesar UI as
a part of GSoC 2023. I have written two more blogs (In case you have
missed them, here is the
link to the collection). In this blog, I will
share how we implemented the
Peak Time Aggregation function using
Modular average.
Here is my
LinkedIn profile,
GitHub profile
and portfolio. There, you will find
numerous ways to get in touch with me. I will be writing more blogs
on my GSoC experience; you can find them
here.
What is Modular Average?
Let's re-explore high school physics.
What is the centre of mass? It is the weighted (according to their
masses) average position of all the parts of the system. So, if we
take an infinitely long massless line and place some masses (say,
m1, m2,..., mn) on it at distances (r1, r2,..., rn), then the mass
of the system will be (m1+m2+...+mn), and the centre of mass will
lie at r, which will be given by,

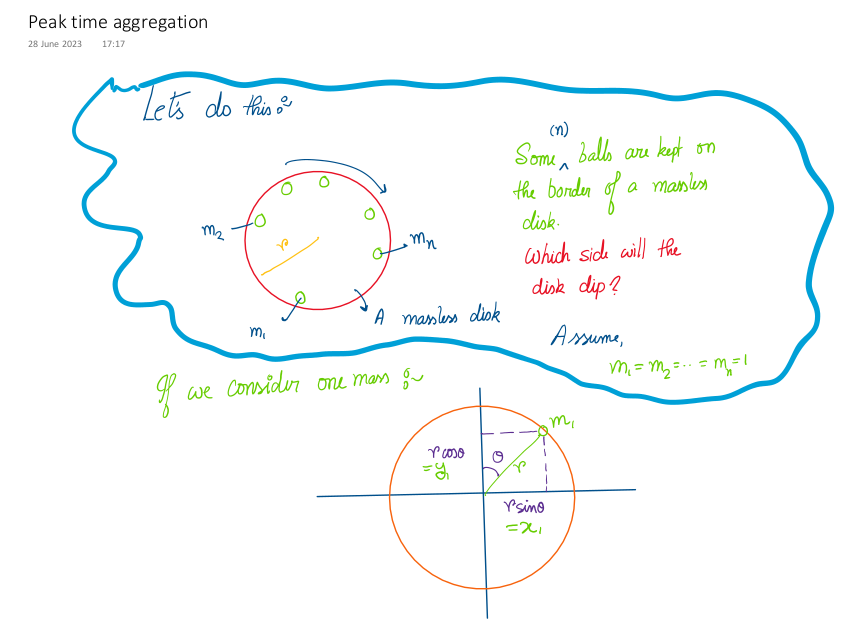
Now, let's solve a slightly different problem.
In place of a line, we now have a massless disc of unit radius,
and unit masses (m1= m2=...=mn=1) are placed on the border of the
disc at some angles (θ1, θ2,..., θn). At what angle will the disc
topple?
The problem will be more general if the particles have masses of m1,
m2,..., mn and a distance of r1, r2,..., rn from the centre (i.e.,
all of them are not placed on the border). The approach will be very
similar, but a little more complex and not required for the
explanation of the aggregation function.
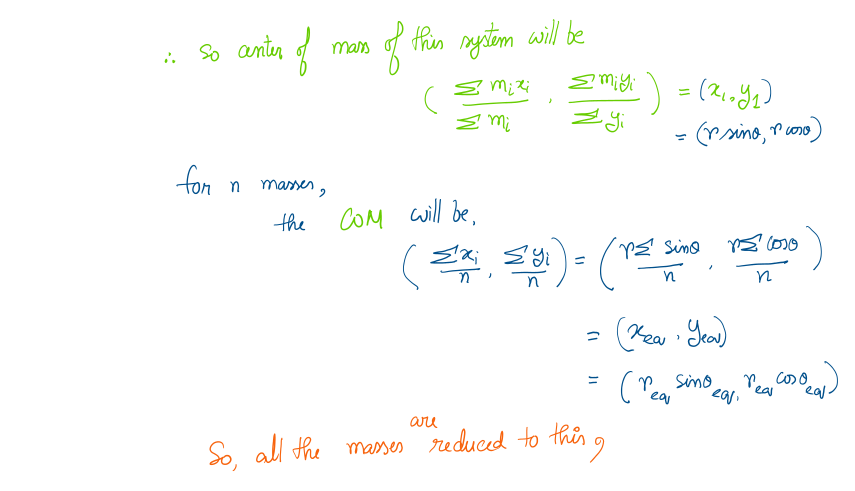
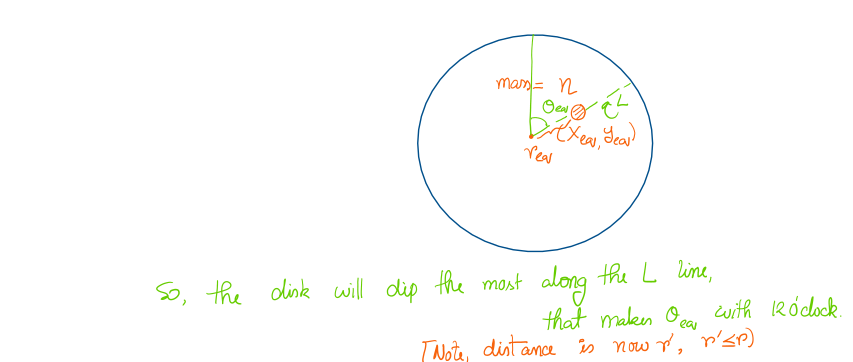
So, let's solve this:
Phew, that was a lot of calculations. Let's understand how it's
related to Modular average and
Peak Time Aggregation.
For modular variables, the main difference is that the values are no
longer linear. Modular variables with modulo n take values in the
range of 0 to n-1, and 0 and n-1 aren't the furthest from each
other; rather, they are adjacent to each other. If we add 1 to n-1,
we will land at 0, and subtracting 1 from 0 will result in n-1.
So, if we try to find the mean of 0 and n-1, we would expect it to
be midway between 0 and n-1, so what's the middle point? We know 0
and n-1 are adjacent, and therefore the pair has a distance of 1
between them. So, it will be at n - 1/2, which has a distance of 1/2
from both points. Practical Example? Circle. When we complete one
rotation around a circle (i.e., 360°), we again land at 0°.
Similarly, we expect the mean of 300° and 0° (or 360°) to be 330°
(not 150°).
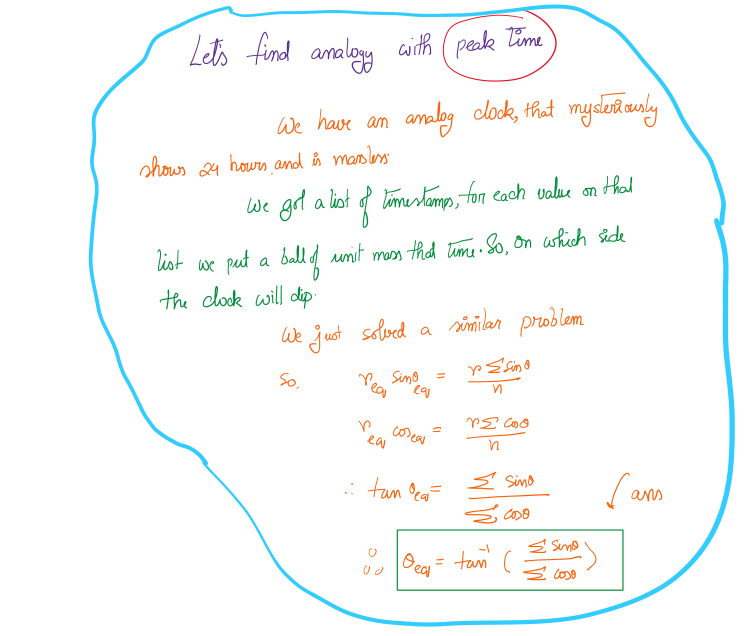
How is it related to peak time aggregation?
Time is a very popular modular variable (to be specific, the year is
not, but all the smaller units of time are indeed modular). So,
similar math will apply when we intend to calculate the mean (or
peak) time. The only thing is that we have to consider time in
24-hour format (not the conventional 12-hour format).
Singularity:
So, what will be the case when the points are at equal distance? Say
three points are placed on the border of the massless disc at 0°,
120°, and 240°. If we follow the mathematical approach, we would get
r_eq = 0 (we would expect the COM of the system to be at the centre
of the disc). So, the mean angle will be null.
So, singularity will arise when COM is at the centre (or r_eq = 0).
Implementing PostgreSQL Custom Aggregation Function:
Once the mathematics were done, we started to implement the
PostgreSQL function to calculate peak times. It was my first time
writing a custom Postgres aggregate. So, I learned a lot.
How does Postgres aggregate work?
Postgres documentation
on user-defined aggregates will be the best place for you to learn
the same. I would briefly discuss things.
A custom aggregate takes a column and iterates over each element of
the column by keeping track of the state variable. State variables
are initialised to a certain value, and the state transition
function is used to update the state variable every time an element
is iterated.
So,
state_var = state_transition_function (state_var,
element)
for every element of the column. The final function is used to
calculate the final value of the aggregation from the state
variable. If you want to go through the implementation details, you
might want to go through my PR mentioned below. I tried my best to
make the variables' and functions' names self-explanatory. If you
have any doubts, please reach out to me.
My progress so far:
The meta issue of my GSoC '23 project can be found
here.
I have implemented the discussed mathematics in the following
PR.
It was a tremendous learning journey for me. Thanks again to the
Mathesar community and Google for giving me this incredible
opportunity.